An out-of-the box implementation of Sage X3 includes three statistical groups for Products, Customers, and Vendors. Statistical groups provide the means to group or categorize products, customers and suppliers for reporting or inquiries. Sage X3 supports up to five statistical groups, so we can create an additional two groups. Let’s see how we can create an extra statistical group in Customer Master.
Step 1) Go to the Development -> Data and Parameters -> Development Setup -> Activity Codes.
Step 2) Select STC Activity code
New Stuff: PREVIOUS() function in Crystal Reports
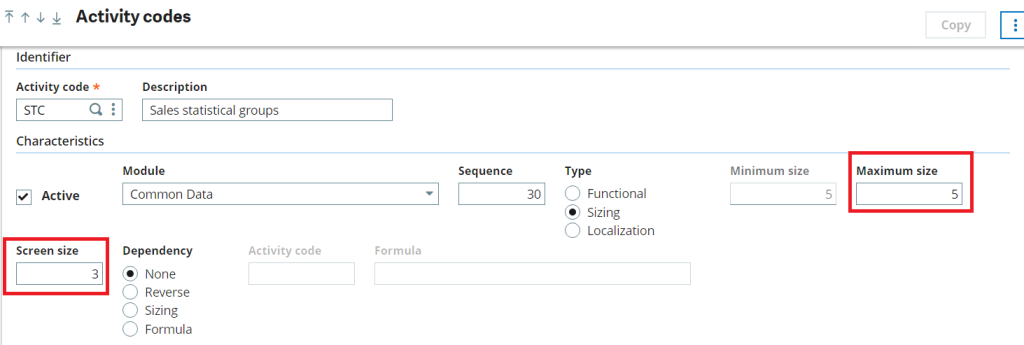
As you can see on the above screenshot we can have at max only 5 Statistical groups because of the restriction in the Activity code.
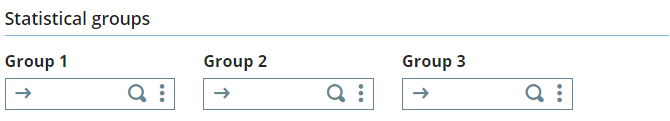
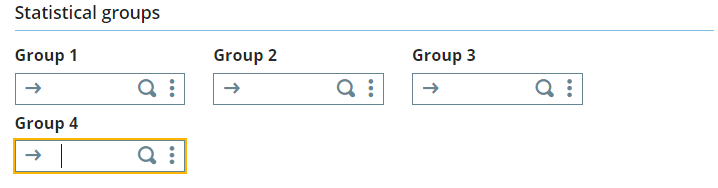
Currently in the Customer master we have only 3 Statistical Groups as mentioned on the activity code STC.
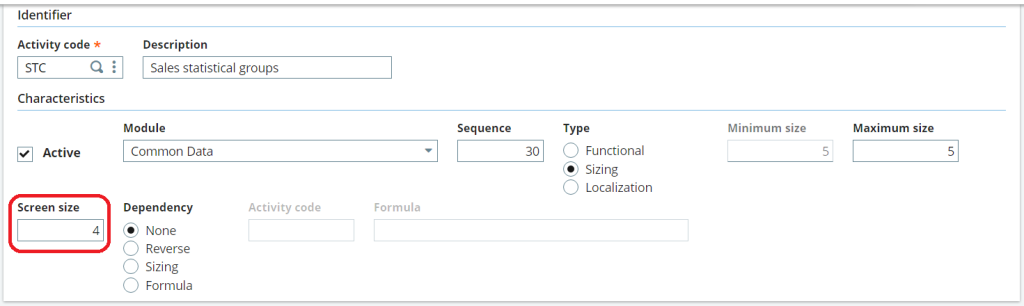
Step 3) Increase the Screen size to 4 or 5 as per your requirement. Here we are going with one extra hence the screen size is 4.
Step 4) Now go to Development -> Utilities -> Dictionary -> Validations -> Dictionary.
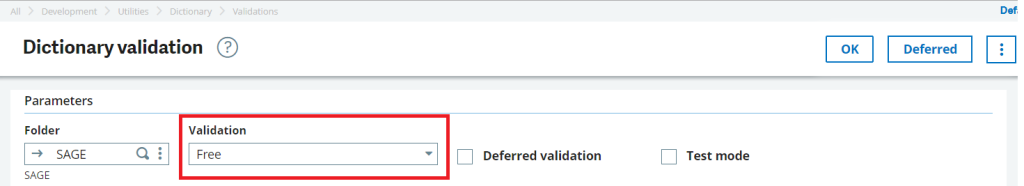
On the Validation click on Complete and hit tab and then on Free and hit tab. At the bottom of the screen you can enter the Activity code as STC.

Step 5) Click on ok. After the validation is finished you can check your Customer Master screen.
Step 6) To see the data on these Statistical Groups 4 and 5 you will have to add data on the Miscellaneous table 33 and 34 respectively.
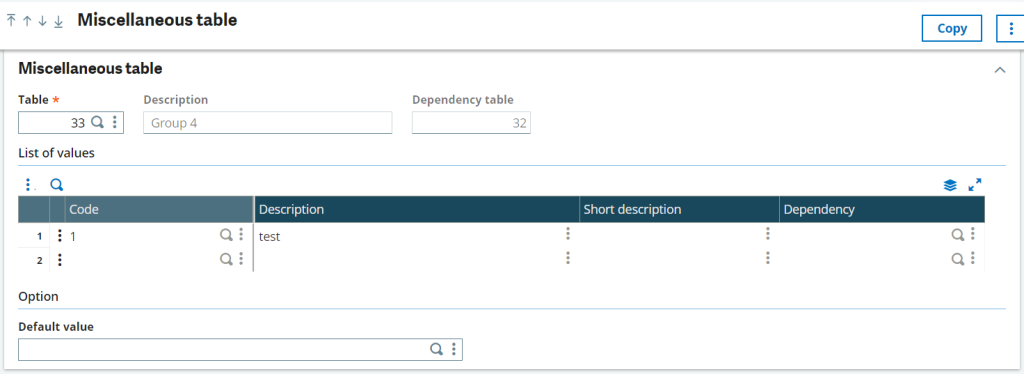
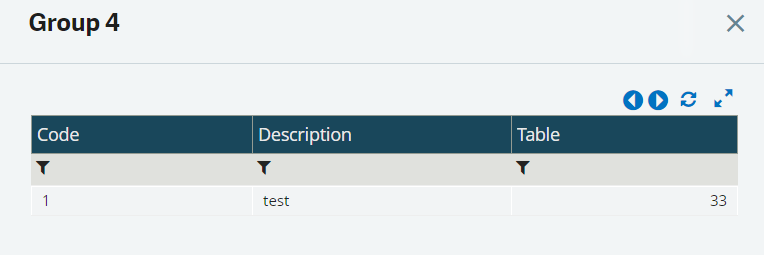
This way when you click on the Group 4 finder button you’ll find the data on this Miscellaneous table 33.
In this way, user can add statistical group by following the above mentioned 6 steps.
About Us
Greytrix – a globally recognized and one of the oldest Sage Development Partners is a one-stop solution provider for Sage ERP and Sage CRM organizational needs. Being acknowledged and rewarded for multi-man years of experience and expertise, we bring complete end-to-end assistance for your technical consultations, product customizations, data migration, system integrations, third-party add-on development, and implementation competence.
Greytrix has some unique integration solutions developed for Sage CRM with Sage ERPs namely Sage X3, Sage Intacct, Sage 100, Sage 500, and Sage 300. We also offer best-in-class Sage ERP and Sage CRM customization and development services to Business Partners, End Users, and Sage PSG worldwide. Greytrix helps in the migration of Sage CRM from Salesforce | ACT! | SalesLogix | Goldmine | Sugar CRM | Maximizer. Our Sage CRM Product Suite includes addons like Greytrix Business Manager, Sage CRM Project Manager, Sage CRM Resource Planner, Sage CRM Contract Manager, Sage CRM Event Manager, Sage CRM Budget Planner, Gmail Integration, Sage CRM Mobile Service Signature, Sage CRM CTI Framework.
Greytrix is a recognized Sage Champion Partner for GUMU™ Sage X3 – Sage CRM integration listed on Sage Marketplace and Sage CRM – Sage Intacct integration listed on Sage Intacct Marketplace. The GUMU™ Cloud framework by Greytrix forms the backbone of cloud integrations that are managed in real-time for the processing and execution of application programs at the click of a button.
For more information on our integration solutions, please contact us at sage@greytrix.com. We will be glad to assist you.